Dashboard
The landing page of a workspace. It exists to answer one question — has this workspace closed the loop yet? — and then to be a quick glance at the numbers.
Get to your first gate
The activation card walks the whole loop once, in order. Every step is derived from a real count in the workspace, never from a flag you tick:
| Step | Done when |
|---|---|
| Send your first trace | the workspace holds at least one trace |
| Let Tracely grade every run | at least one evaluator column is enabled on the Traces table |
| Catch a real failure | at least one trace has failed a non-advisory evaluator |
| Promote a failure to a regression case | a case exists |
| Gate a pull request | a gate run exists |
Since 2026-09 the card reads durable activation milestones instead of counts: first trace received → first check completed → source failure confirmed → case reproduced → candidate verified → CI check completed. Each is recorded by the backend from the operation itself (an ingested trace, a written verdict, a validated promote, a recorded-mode replay that reproduced the failure, a candidate that passed, a run-scoped gate that finished PASS or FAIL) — never from a click, a resource count, an empty gate or a source-only validation — and survives a new browser. Try the sample seeds a labelled sample agent with a real reproducible bug and its fix (the same make demo path); sample data is stamped sample everywhere and never ticks a step. Connect my agent jumps to the real path. Workspaces from before milestones existed keep the old count-derived ticks. Operators see counts and drop-off per milestone, real vs sample, at GET /api/admin/milestones/funnel.
Each step shows the exact snippet or the button that completes it (an instrumented Python snippet, a tracely gate command, a link to the right screen). Once every step has happened the card disappears for good — it is an onboarding aid, not a status page.
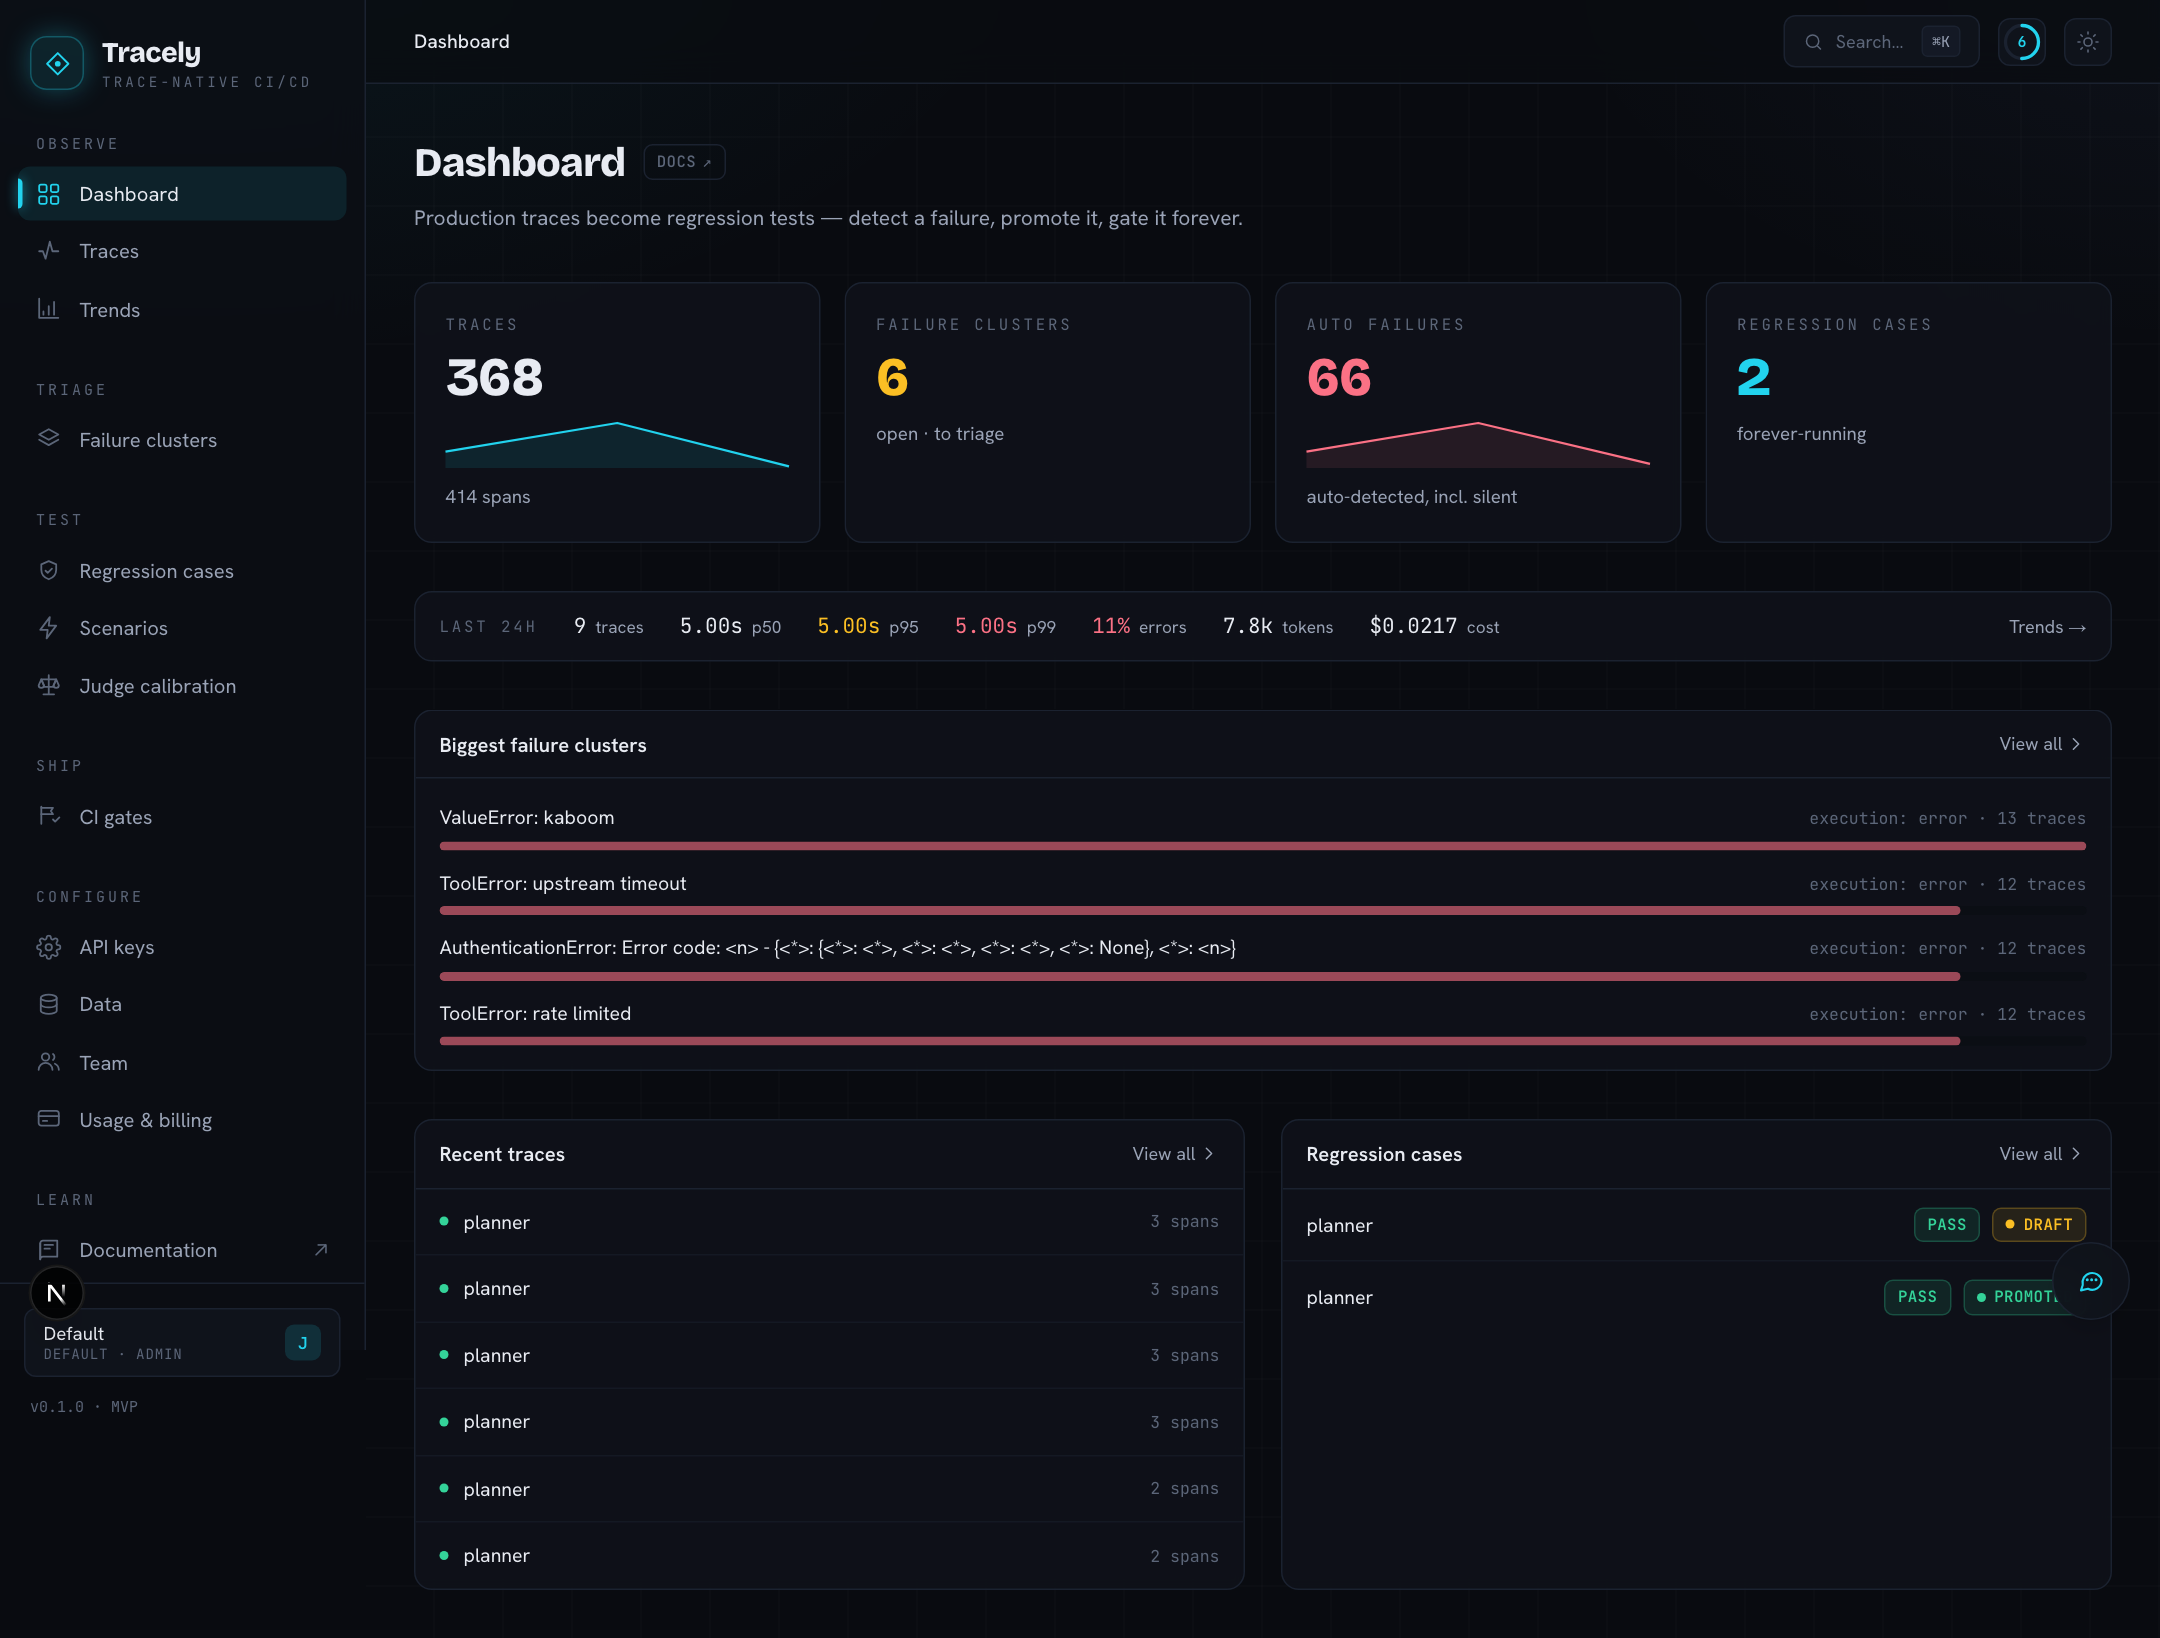
Stat cards
Traces, Failure clusters (open issues), Auto failures (runs a non-advisory evaluator failed) and Regression cases. The same counts feed the Trends page; here they are the current totals.
Operations strip
The health row under the stats — latency percentiles, error rate, throughput, tokens and cost for the last days — is the compact form of the operations panel described in Trends → Operations.
Biggest failure clusters · recent traces · recent cases
Three short lists that are just links into the pages they summarise: the largest open issues (→ Failure clusters), the latest conversations (→ Traces) and the latest regression cases (→ Regression cases).