Alerts
Runs → Alerts (or Alert on fail on any evaluator). An alert rule has two halves: when it fires, and what happens — drawn as a flow.
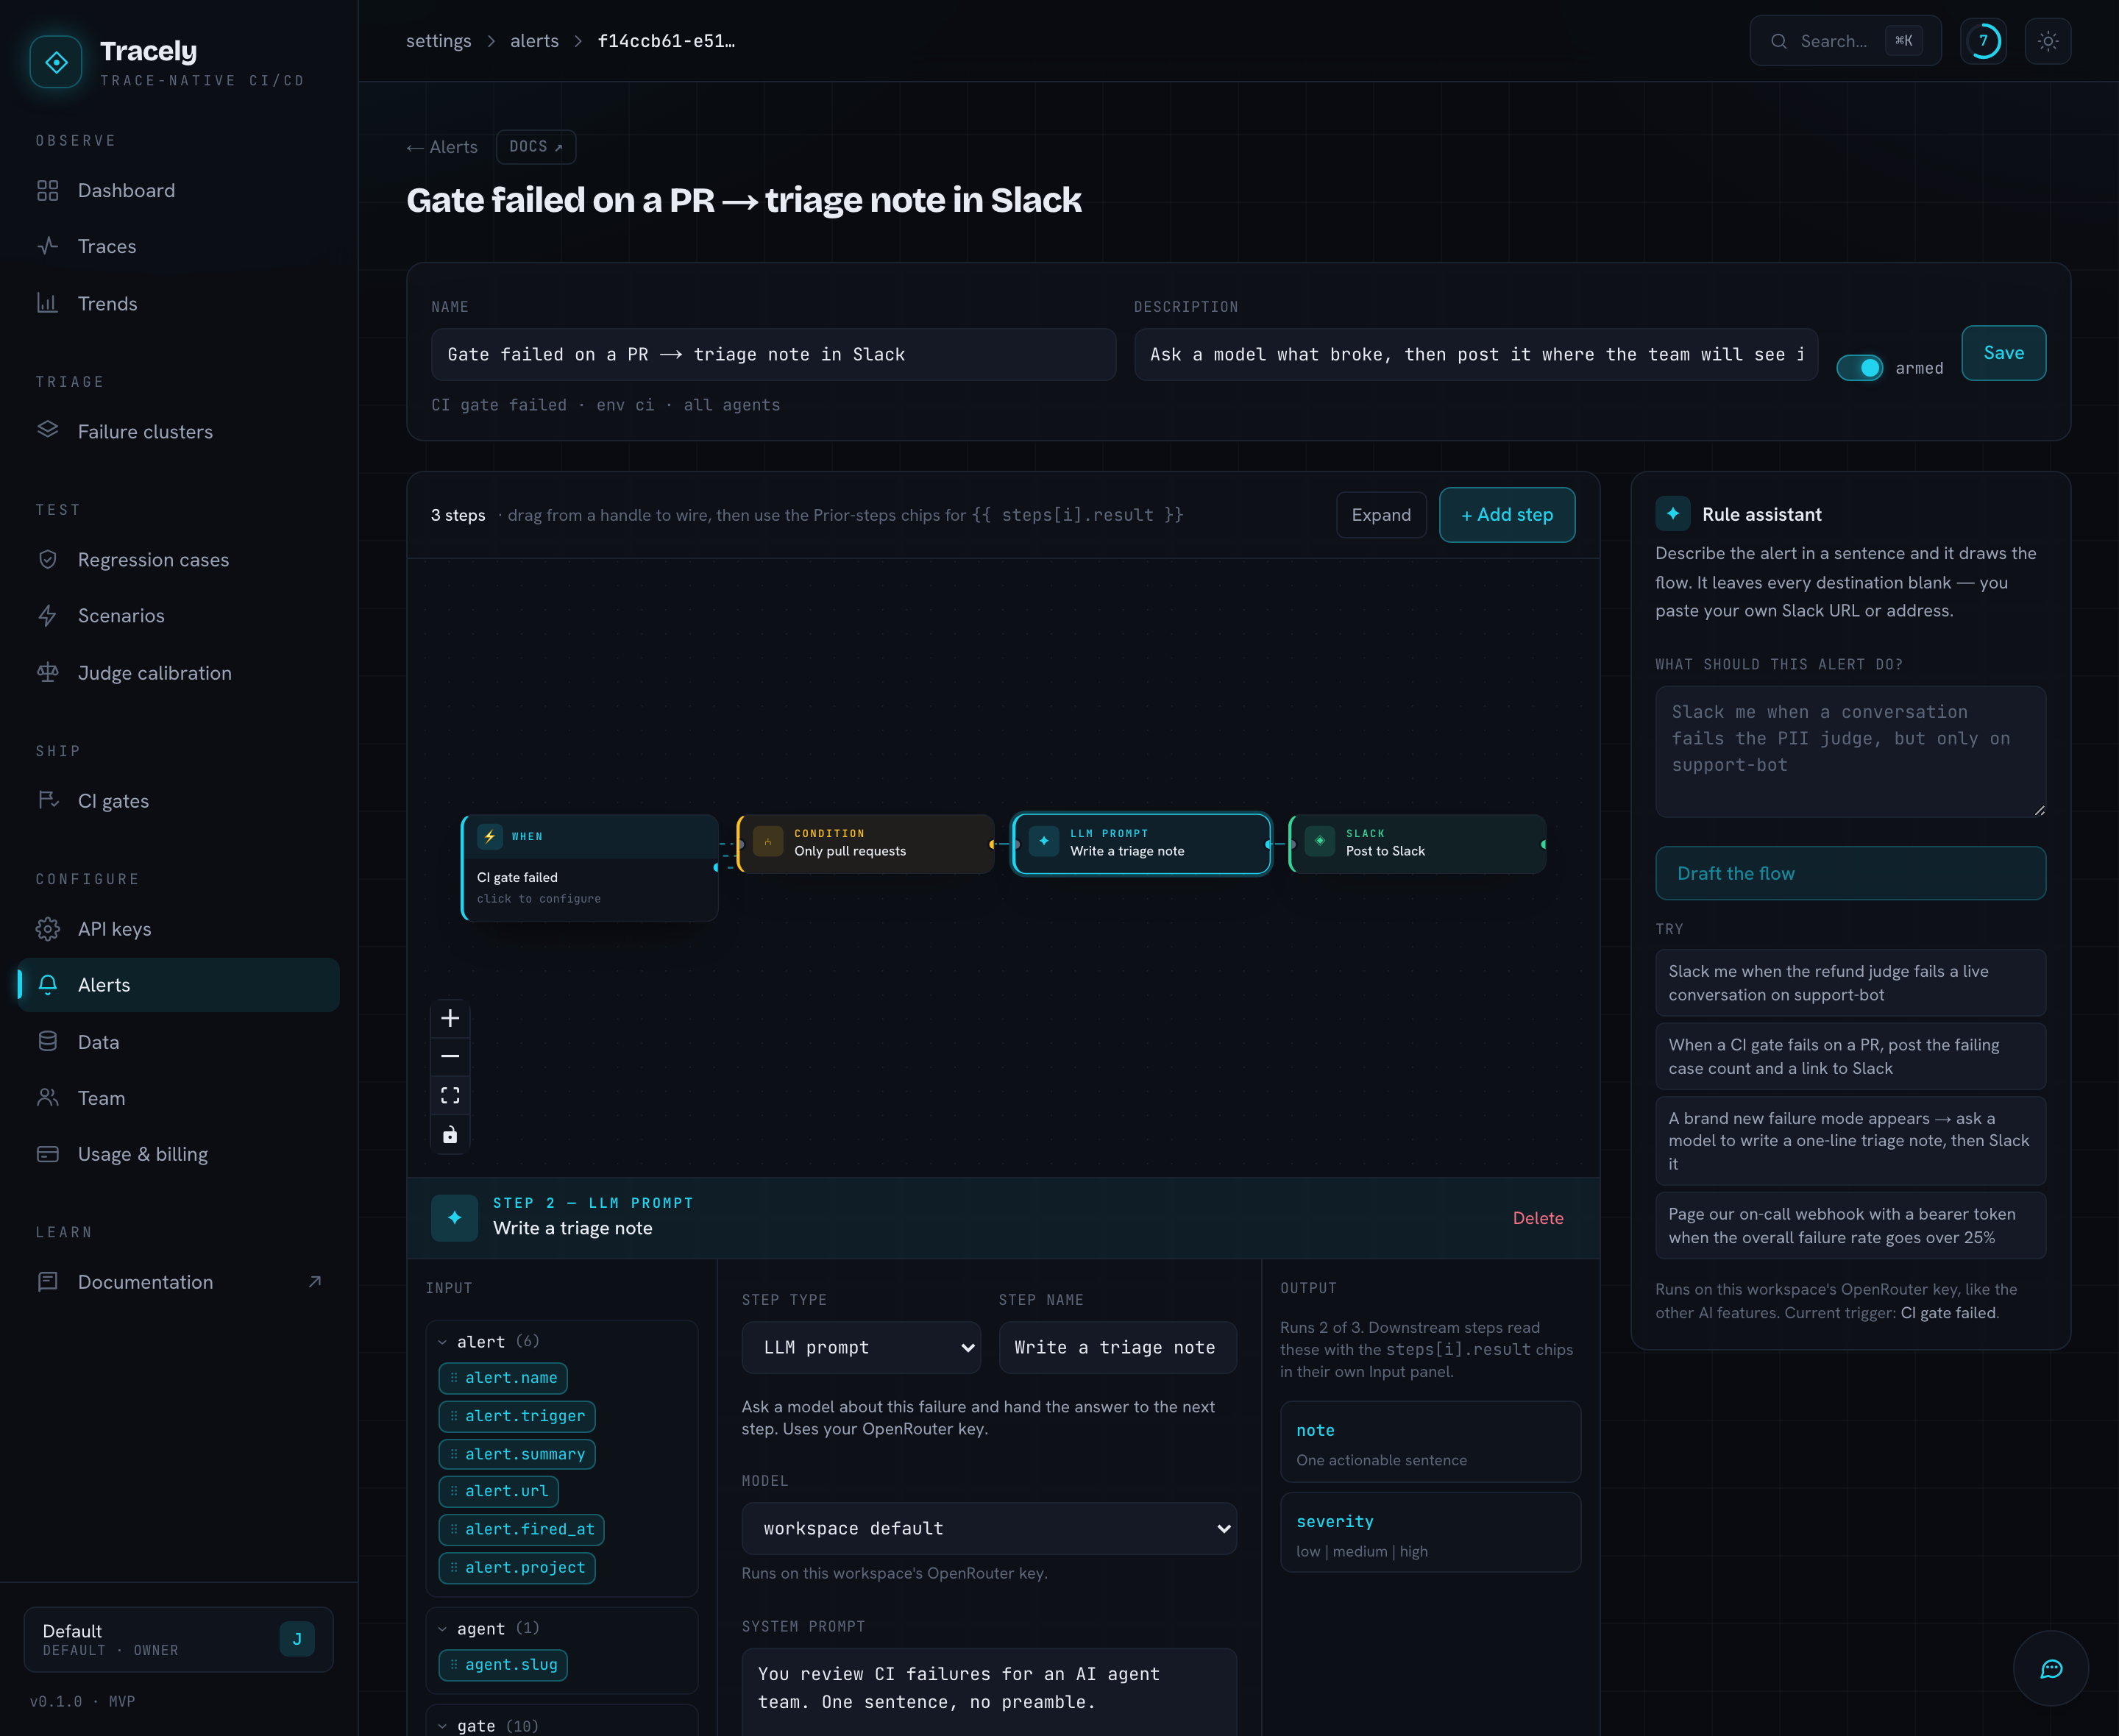
Rules are workspace-level and optionally scoped to a single agent.
When — the trigger
Click the When node to choose it. Two families:
| Fires | Good for | |
|---|---|---|
| Event | the moment it happens, inline in the pipeline | a gate failing on a PR, a live conversation breaking, a failure mode nobody has seen before |
| Threshold | evaluated every 5 minutes over a sliding window | quality sliding after a deploy, a rate creeping up |
CI gate failed — a gate run finished FAIL, NO_COVERAGE or INCOMPLETE. NO_COVERAGE
counts on purpose: a suite that could not run is the quietly-green failure nobody notices.
Filters: env, and text (matches the gate summary and its soft warnings).
Conversation failed — a production turn failed a non-advisory evaluator. Advisory evaluators are excluded for the same reason they never flip a verdict anywhere else. Filters: one evaluator, and text (matches both the evaluator names and the judge’s own reason).
New failure mode — a new failure cluster was created. Filter: text against the cluster label.
Evaluator FAIL rate over / Average score below / Overall failure rate over — a rate or
average across a window. Min samples keeps 1-of-1 from reading as 100%; thresholds are strict, so
a rate exactly at the line does not page.
Rate limit caps how often the rule notifies: every time, or at most once per 5 / 15 / 30 min, 1 h or 6 h. It is a rate limit, not deduplication — two gates failing inside the window produce one run.
What happens — the flow
Drag from a node’s right handle to another node’s left handle to wire it. Steps run in the order they are wired, and a step that is not reachable from the When node is parked: saved, visible, and deliberately not run.
| Step | Does | Produces |
|---|---|---|
| Condition | A gate. Renders an expression; anything falsy stops the rest of the flow. | matched, expression |
| Slack | Posts a templated message to an incoming webhook. | status, text |
| Send email | Mails one or more addresses (needs RESEND_API_KEY). | status, recipients |
| Webhook | Any verb, your own headers (Authorization: Bearer …), a templated JSON body. | status, text |
| LLM prompt | Asks a model about this failure. Optional structured output fields. Runs on your OpenRouter key. | text, or one field per declared output |
| Python expression | One allowlisted expression — counting, slicing, a threshold a template can’t compute. | result |
The Webhook step is the escape hatch: arbitrary headers and a body you write, so PagerDuty, Jira, Linear or an internal endpoint behind a bearer token all work. There is a + Bearer token shortcut next to + Header, and header values are templates too.
Variables
Every string field is a template. The Input column of the inspector lists every variable the
trigger provides — drag a chip into any field, or type {{ … }} yourself. Tokens are highlighted as
you type, and Backspace next to one deletes the whole token.
alert.*—name,trigger,summary,url(deep link to what fired),fired_at,projectagent.slugtrace.*—id,url,thread_id,input,output,error,latency_ms,tokensfailing_evaluators,failure_reason,scoresgate.*—status,env,git_ref,pr_number,passed,failed,skipped,warningscluster.*—label,taxonomy,urlmetric.*—name,value,threshold,window_minutes,sample_size
Which of those are populated depends on the trigger, and the panel only offers the ones that are.
Reading an earlier step
An upstream step’s output is positional: {{ steps[0].result }} is the first step upstream of
the one you are configuring, steps[1] the second. Two parallel branches each see their own
steps[0]. The Prior steps chips are generated from the same walk the engine does, so the chip
label is the runtime path.
When (conversation failed)
  → LLM prompt   "write a one-line triage note"      declares: note
  → Slack        "{{ steps[0].result.note }} — {{ trace.url }}"
Drafting with the assistant
✦ Ask the assistant (or ⌘J) opens the in-app chat with the editor in view. Describe the alert and the canvas redraws as the assistant works: the trigger, its filters, and the steps, wired.
"Slack me when a conversation fails the PII judge, but only on support-bot"
→ When: Conversation failed · text contains "pii" · agent support-bot
→ Slack: ⚠️ {{ failing_evaluators | join(', ') }} on {{ agent.slug }} …
It is good at the shape of a rule — which trigger, which filters, how many steps, what each template should read. Three things it deliberately does:
- It never invents a destination. Every
urlandtocomes back empty and it says so in its reply, so a drafted rule can’t post into someone else’s Slack. You paste yours and save. - It edits rather than restarts. The rule as the canvas has it right now is sent with your message, and the chat remembers the conversation, so “add a condition so it only fires for the refund agent” keeps the steps you already configured.
- It picks filters over steps. A trigger filter (evaluator, text, env, agent) stops the flow from running at all, so it prefers one of those to a condition step whenever the trigger supports it.
What comes back is a draft on the canvas, not a saved rule: nothing exists until you press Save, and nothing fires until the rule is armed. Follow it with Run test to see the real messages before you leave.
Things worth asking for:
| Ask | What you get |
|---|---|
| ”Page our on-call webhook with a bearer token when the overall failure rate goes over 25%“ | The threshold trigger plus a webhook step with an Authorization: Bearer header ready for your token |
| ”When a new failure mode appears, ask a model for a one-line triage note and post it to Slack” | An LLM step with a declared output, and a Slack step reading {{ steps[0].result }} |
| ”Email the team when a gate fails on main, but not on other branches” | CI gate failed + an env filter, or a condition step on {{ gate.git_ref }} |
| ”Only alert me about refunds” | A contains filter on the trigger rather than a step |
It runs on your workspace’s OpenRouter key, like the other AI features — with no key configured the panel says so and the canvas still works by hand.
The in-app assistant (⌘J) can also create the simple shape for you — one trigger, one destination — from anywhere in the app: “Slack me when the refund judge fails a conversation”. It hands back a link to the rule so you can open the builder and add steps.
Test it, then arm it
Run test executes the flow now and shows every step: what it sent (each field after
templating — so you can see {{ trace.url }} resolved to a real link) and what it returned. For
an event rule you pick a real subject: a recent failing turn, a gate run, a cluster.
A test has real side effects — it posts to Slack, mails the address, calls your webhook. That is the point: it is the same code path the real alert uses.
Recent runs keeps the last ten with the same per-step detail. A run whose condition evaluated
falsy is recorded as skipped, which is how you tell “the gate stopped it” from “nothing happened”.
Where to start
The list page opens with a gallery of use cases; each one opens as a working flow you finish by pasting one URL.
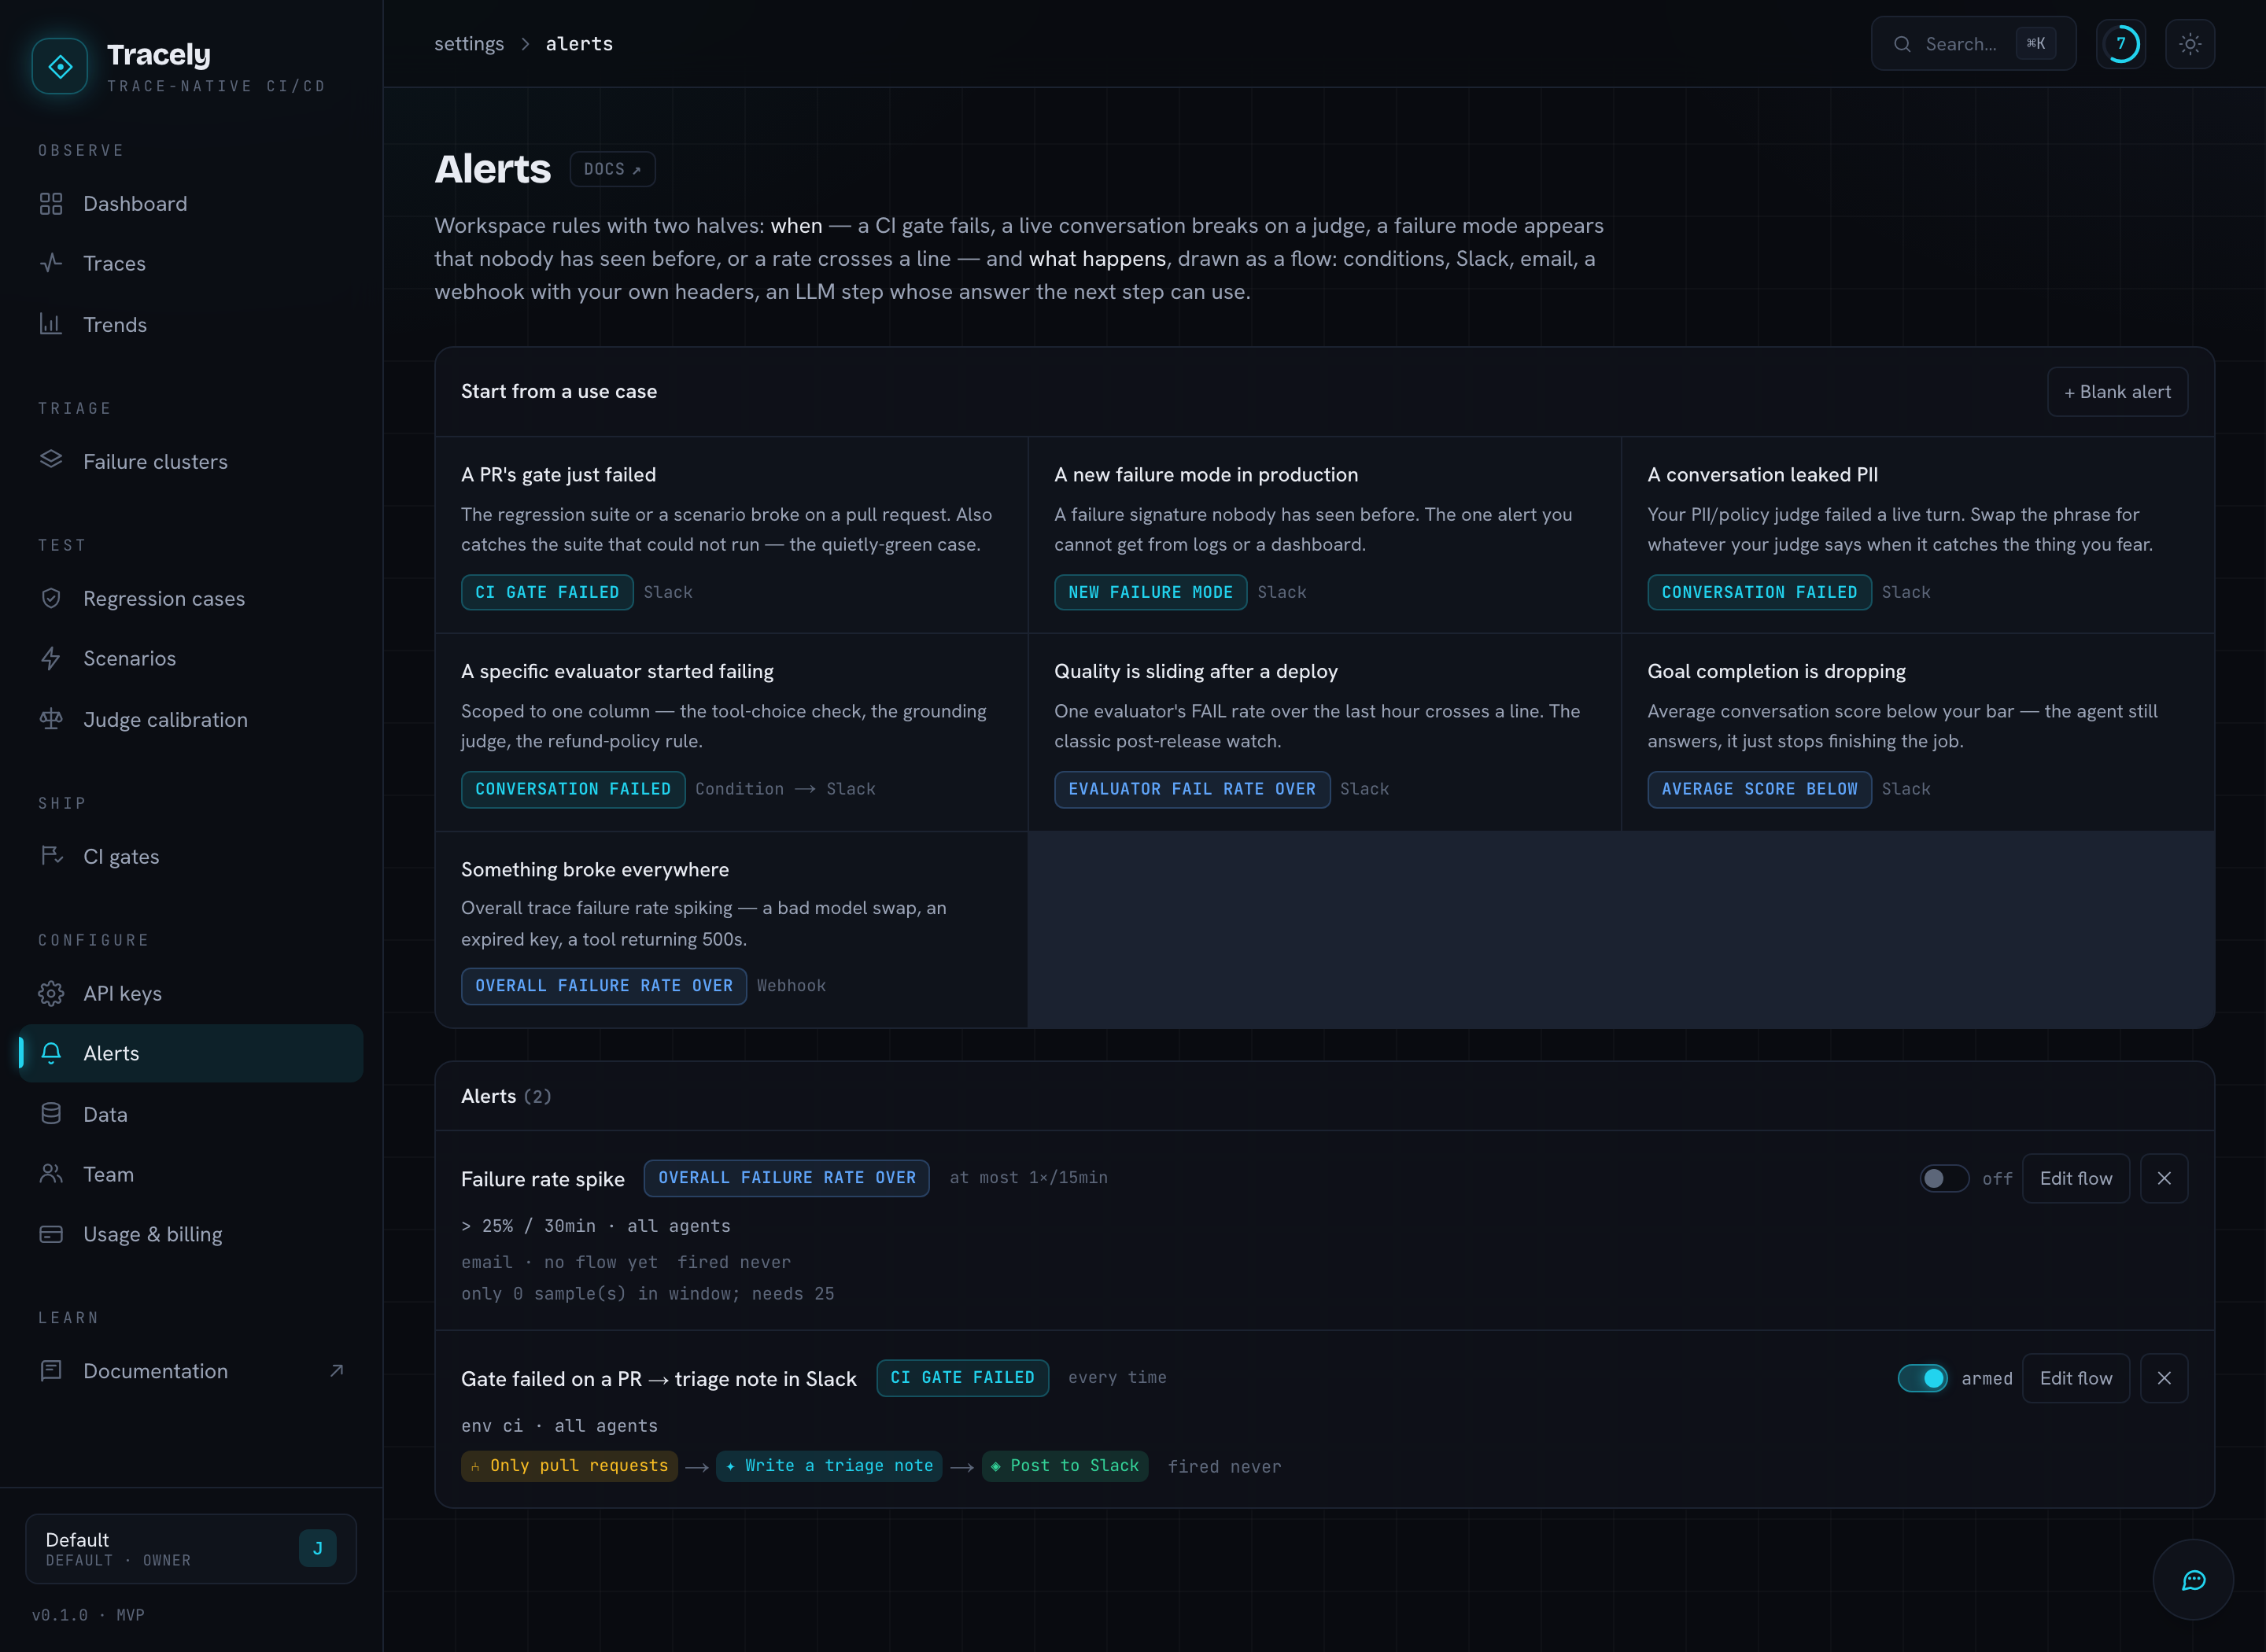
| Use case | Trigger | What it catches |
|---|---|---|
| A PR’s gate just failed | CI gate failed | The regression suite or a scenario broke on a pull request — including the suite that could not run. |
| A new failure mode in production | New failure mode | A signature no trace has produced before. The alert you cannot get from logs. |
| A conversation leaked PII | Conversation failed + text | Your PII/policy judge failed a live turn. |
| A specific evaluator started failing | Conversation failed + evaluator | Scoped to one column, with a condition step narrowing it further. |
| Quality is sliding after a deploy | Evaluator FAIL rate over | One evaluator’s FAIL rate over the last hour crosses a line. |
| Goal completion is dropping | Average score below | The agent still answers, it just stops finishing the job. |
| Something broke everywhere | Overall failure rate over | A bad model swap, an expired key, a tool returning 500s. |
Notes
- Only members can create or change alerts. An ingest key can read them but never re-point where a workspace’s alerts go — a leaked CI key should cost traces, not your incident channel.
- Every URL is checked for reachability at save time and again immediately before the request, so an alert can’t be aimed at something inside the deployment’s network. A templated URL is checked once it renders.
- Templates run in a sandbox and the Python step uses an allowlist — no
import, no attribute dunders, no file or network access. - Re-running evaluators from the traces grid can fire conversation alerts: the FAIL is real, the trace just isn’t new. That is what the rate limit is for.
- Tracely’s own internal runs (an evaluation, a scenario) never alert — they are not evaluated at all.
- Threshold rules need the Celery beat scheduler running. Event rules don’t: they fire inline from the pipeline that produced them.
- A rule with no steps falls back to the older channel list, so alerts created before the flow builder (or by the assistant) keep working — open one and draw a flow to migrate it.